
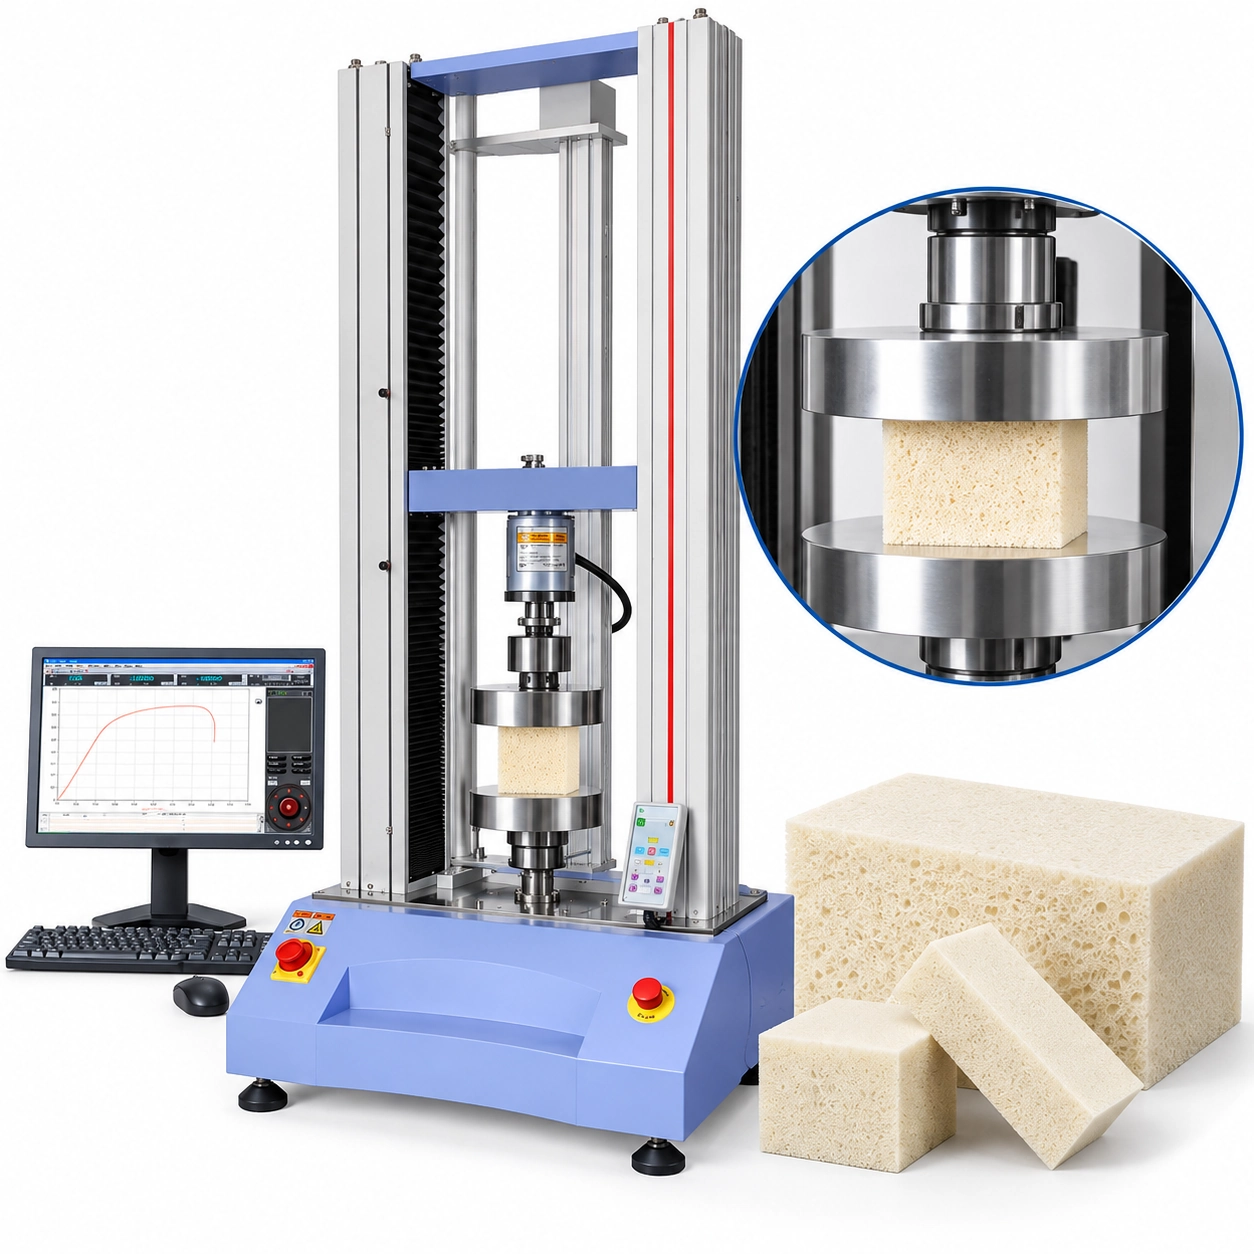
Two rigid foam specimens both reach 2.5 kN during compression.
The first is reported at 0.25 MPa. The second is reported at 1.00 MPa.
At first glance, that looks like a calculation error. It may not be.
If the first specimen has a loaded face of 100 × 100 mm and the second only 50 × 50 mm, the load cell can measure exactly the same force while the calculated compressive stress differs by a factor of four.
That is a useful way to think about an ASTM D1621 compression test.
The machine measures force and displacement. The engineering result depends on what those measurements mean for a particular piece of rigid cellular plastic.
Area matters. Original height matters. Loading direction matters. The shape of the compression curve matters too.
And unlike many solid materials, rigid foam does not always give you a convenient failure peak to report.
ASTM D1621-16(2023) covers the compressive properties of rigid cellular materials, particularly expanded plastics. The method uses load-deformation data to determine compression properties such as compressive stress, compressive strength at maximum load where applicable, and effective modulus.
For a test engineer, the useful question is not simply:
How much force can the machine apply?
It is:
Can the system measure what this foam is actually doing under compression?
What Does ASTM D1621 Measure?
Rigid foam is not simply a low-density version of solid plastic.
Its mechanical response comes from a cellular structure: polymer walls and struts surrounding void space. Under compression, those cells deform, buckle, crush, and eventually pack together.
That produces a response quite different from conventional solid engineering plastics.
ASTM D1621 uses controlled compression to characterize this behavior. Depending on the material response and the required result, the test can provide information about compressive stress, compressive strength, deformation, the complete load-deformation response, and effective modulus.
The important point is that these properties come from the relationship between force, specimen dimensions, and deformation—not force alone.
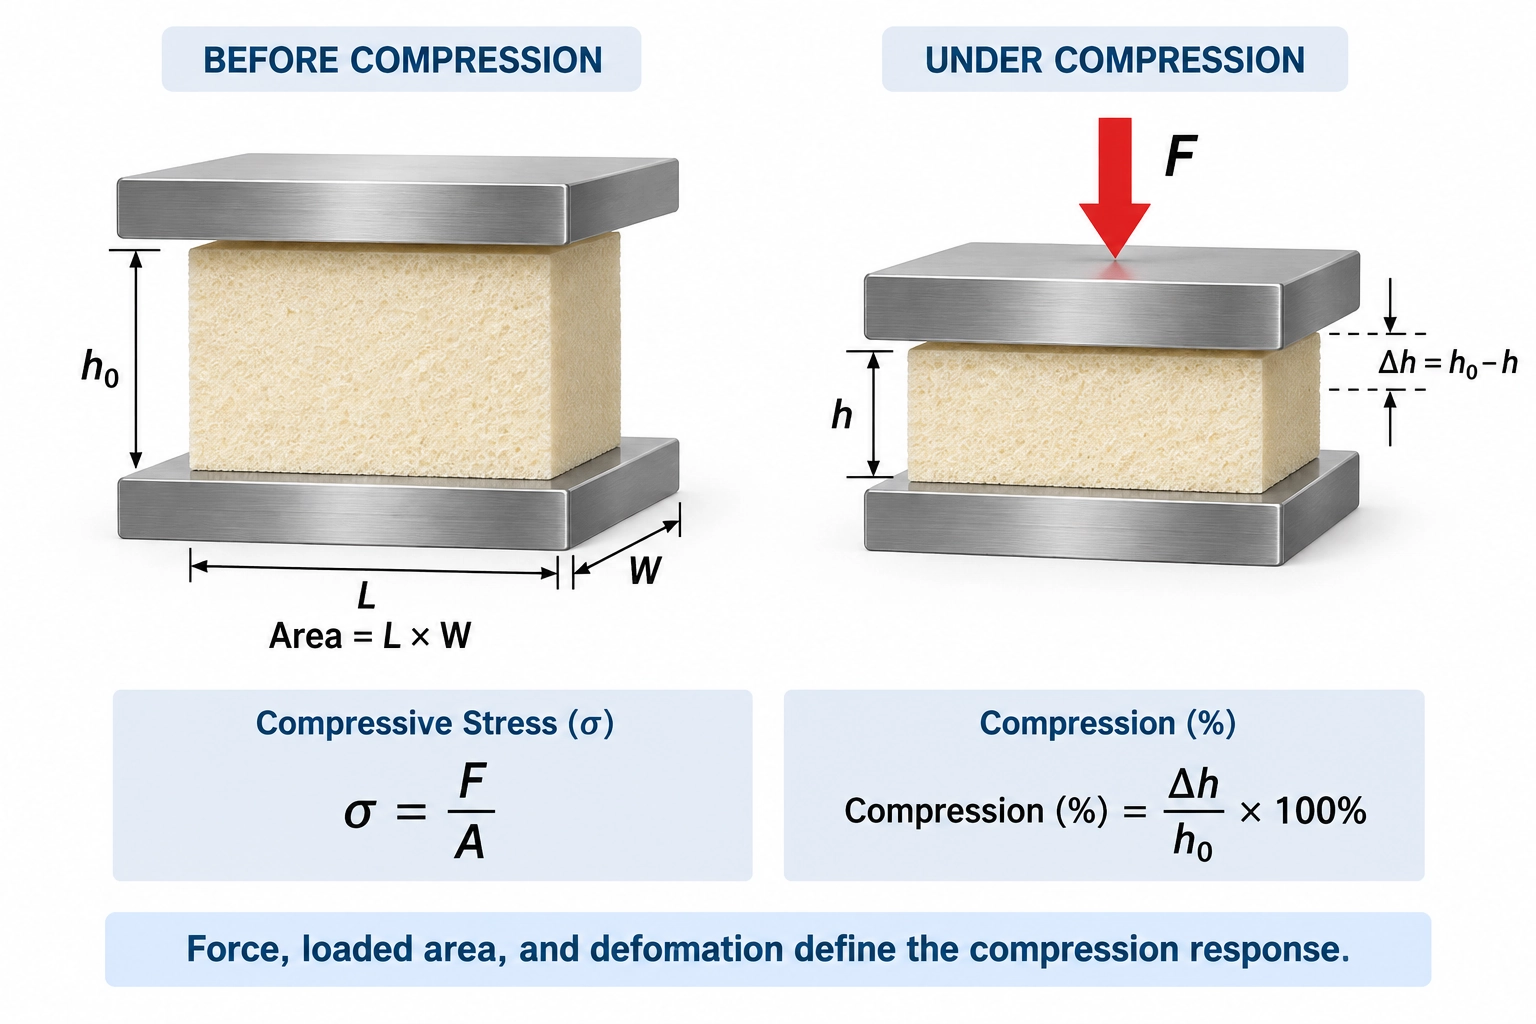
Force Is Not Compressive Stress
Suppose a rigid PU foam specimen reaches:
2,400 N
Its loaded face measures:
100 × 100 mm
The loaded area is therefore:
10,000 mm²
and the corresponding stress is:
2,400 / 10,000 = 0.24 MPa
Now take a smaller specimen with a loaded face of:
50 × 50 mm
If that specimen also reaches 2,400 N:
2,400 / 2,500 = 0.96 MPa
Same force.
Four times the calculated stress.
This distinction becomes particularly important when specifying a testing machine. A material datasheet that gives an expected compressive stress of 0.6 MPa does not yet tell you whether the test requires 1 kN, 6 kN, or 20 kN.
You still need the loaded area.
For preliminary machine sizing:
Expected Force ≈ Expected Stress × Loaded Area
For example, a 0.6 MPa material tested over a 100 × 100 mm face gives:
0.6 N/mm² × 10,000 mm² = 6,000 N
or approximately:
6 kN
That number is much more useful for equipment selection than the ASTM designation by itself.
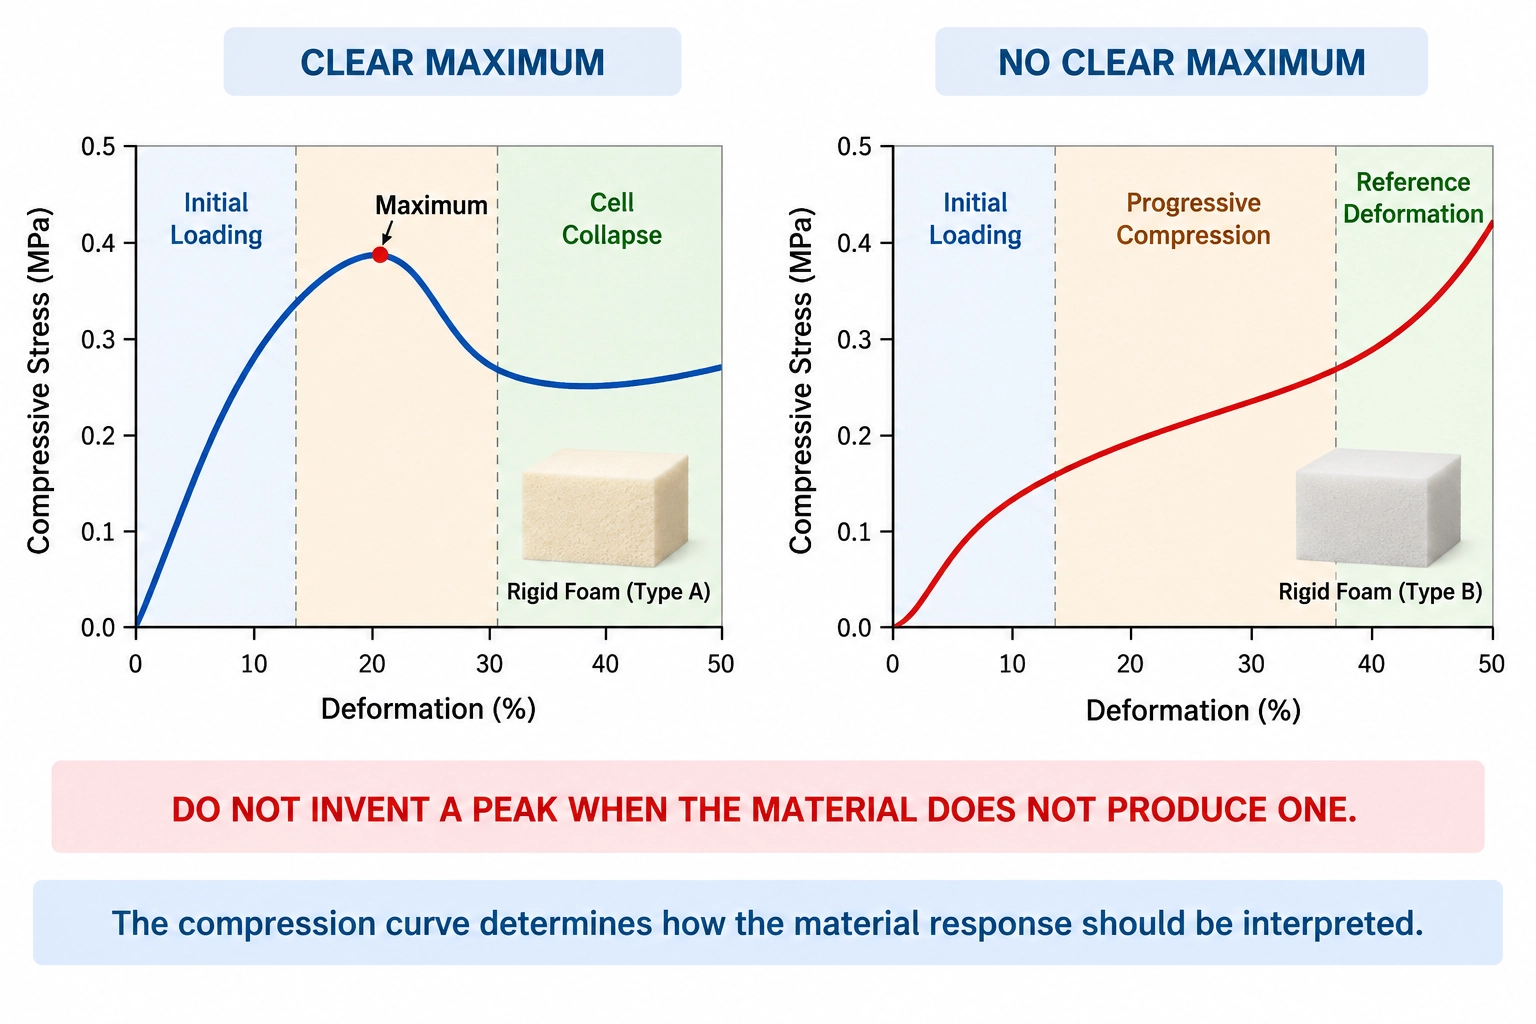
The Curve Does Not Always Give You a Convenient Peak
This is where rigid foam compression testing becomes more interesting.
Some materials produce a recognizable maximum in the compression response.
Others do not.
Instead, the curve may move through progressive cellular collapse without producing the kind of distinct early peak an operator expected to see.
That creates a practical problem.
A software template built around:
Find Maximum Force → Divide by Area → Report Strength
works nicely until the foam does not produce a meaningful maximum in the expected region.
The answer is not to select the highest number on the screen simply because the software needs one.
The reported property has to follow the evaluation defined by ASTM D1621 for the observed material response.
A good first step is therefore to look at the whole compression curve, not only the result box.
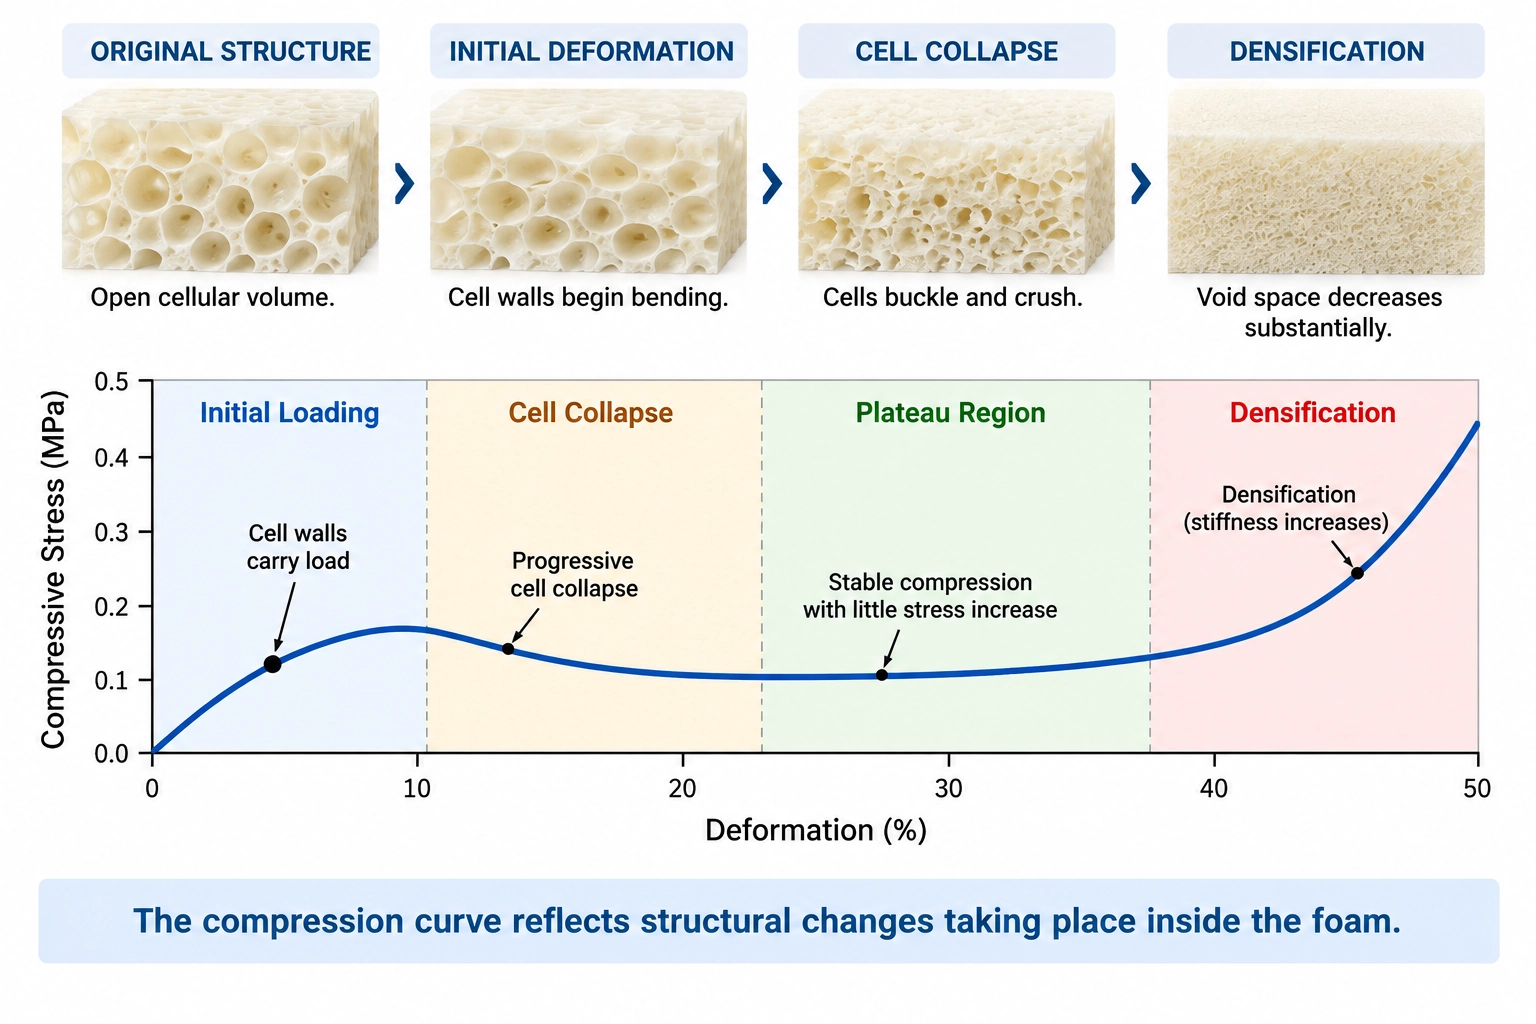
What Happens Inside the Foam?
The shape of the curve makes more sense when you look at the cellular structure.
Before loading, much of the foam's volume is void space.
During the initial part of the test, the cell walls and struts carry load and begin to deform. As compression increases, buckling, crushing, or fracture can spread through the cellular network.
This can create a region where relatively large deformation occurs without the proportional stress increase you might expect from a dense solid polymer.
Continue compressing and the available cellular space becomes progressively smaller.
Eventually the material enters densification.
At this stage, further platen movement increasingly forces already compressed material together. Apparent stiffness rises rapidly, which is why the end of a foam compression curve can turn sharply upward.
That steep rise does not automatically represent a useful material strength point.
It can simply mean the cellular structure has entered a different stage of compression.
Same Foam, Different Loading Direction
A supplier reports a compressive strength of 0.62 MPa.
Your incoming inspection gives 0.48 MPa.
Before questioning either laboratory, check one thing:
How were the specimens oriented?
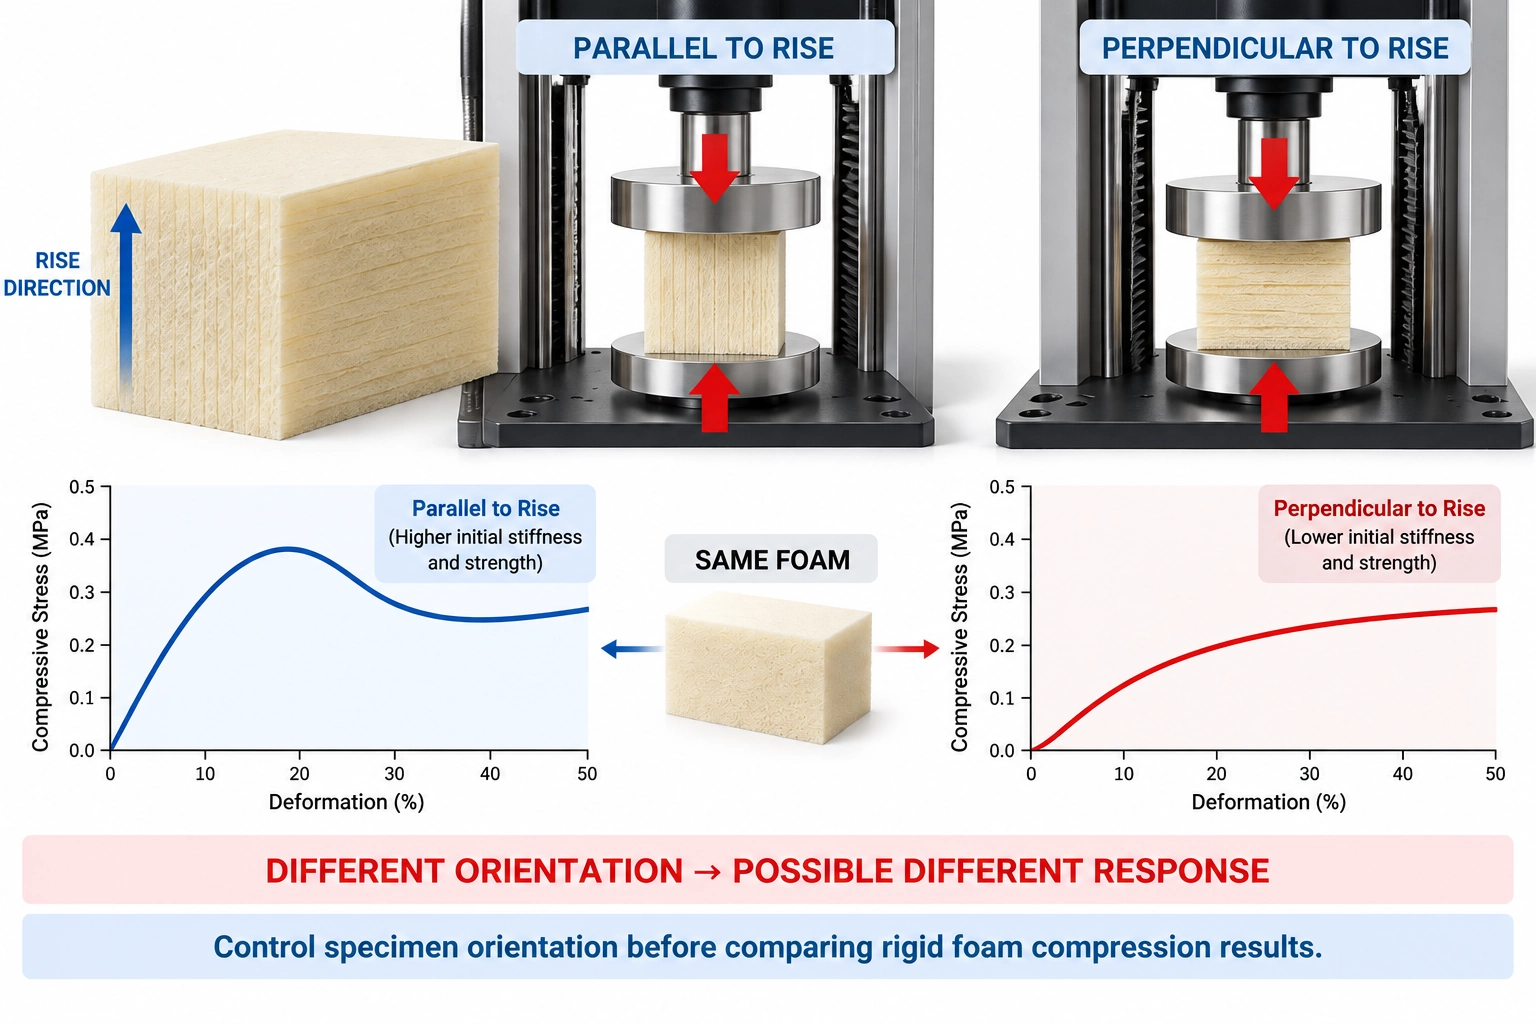
Rigid foam can be anisotropic.
During manufacturing and expansion, the cellular structure may develop a preferred direction. Cells can become elongated along the rise direction rather than remaining mechanically identical in every orientation.
Now take two specimens from the same panel.
Compress one parallel to the rise direction.
Test the other in a different orientation.
Same material. Same nominal density. Same machine.
But the cellular structure is being loaded differently, so the compression response can change.
For supplier qualification and routine QC, specimen orientation therefore needs to be controlled alongside specimen dimensions.
Otherwise, genuine material anisotropy can look like poor machine repeatability or a supplier-to-supplier discrepancy.
Two Dimensions, Two Different Errors
For rigid foam compression, specimen dimensions are not just information for the test report.
They participate directly in the calculation.
And an error in width or length does something different from an error in height.
Loaded Area Changes Stress
Suppose the measured force is:
3,000 N
and the actual loaded area is:
100 × 100 = 10,000 mm²
The calculated stress is:
0.30 MPa
If an incorrect area of 9,000 mm² is entered, the same measured force becomes:
0.333 MPa
Nothing changed mechanically.
The load cell still measured 3,000 N.
The dimensional input created the difference.
Original Height Changes the Deformation Reference
Now consider a specimen with an actual original height of:
50.0 mm
It is compressed by:
5.0 mm
The nominal compression is:
5 / 50 × 100 = 10.0%
If the original height is incorrectly entered as 45.0 mm:
5 / 45 × 100 = 11.1%
Again, the machine performed exactly the same movement.
Only the reference dimension changed.
Yet the reported deformation moved from 10.0% to 11.1%.
That matters when a result is evaluated at a defined deformation.
A Simple Test Can Still Have a Bad Mechanical Setup
Foam block. Upper platen. Lower platen. Compress.
Mechanically, ASTM D1621 looks straightforward.
That simplicity can hide setup problems.
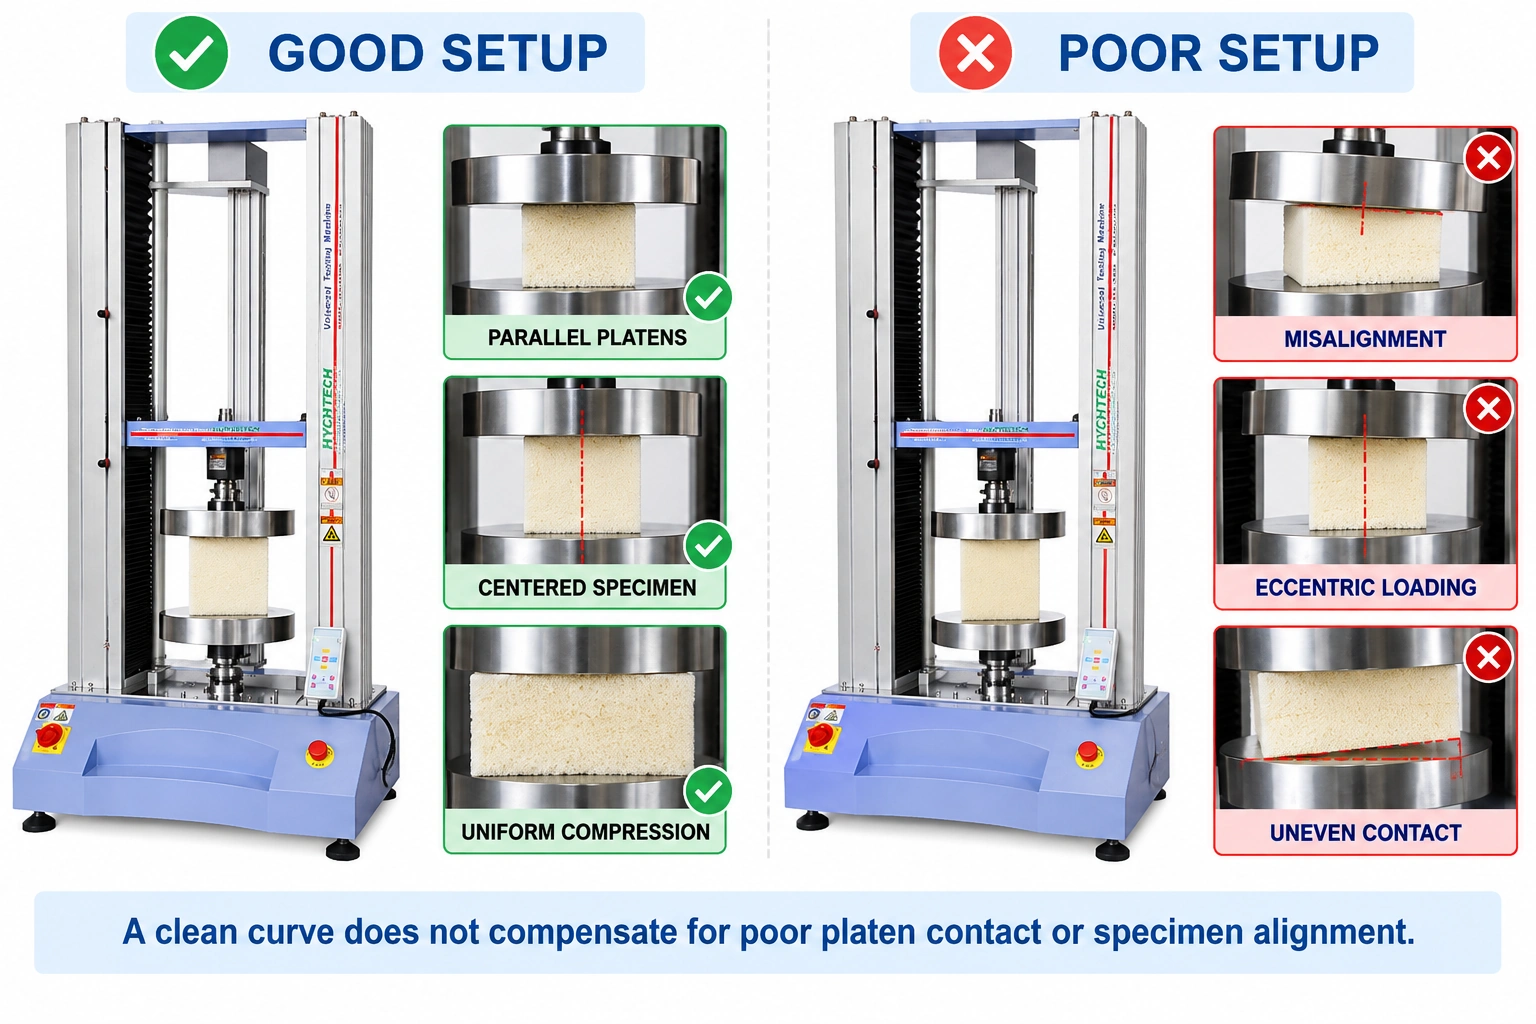
With parallel surfaces, a centered specimen, and correctly aligned platens, the load develops across the specimen face in a controlled way.
Tilt the upper platen slightly and one edge can contact first.
Place the specimen well off-center and the compression condition becomes eccentric.
Use a specimen with a poor loaded surface and local compression can begin before the full face is carrying load.
The software may still display a smooth-looking curve.
That does not mean the specimen experienced uniform compression.
When the Compression Curve Looks Wrong
A strange curve does not immediately prove that the foam is defective.
The shape of the curve often tells you where to investigate.
If force rises unusually fast at the beginning, check the initial contact condition. Look for unintended preload, uneven specimen surfaces, or one-sided platen contact.
If the curve is noisier than expected, do not assume electrical noise first. Cellular structures can crush or fracture progressively, and those events can appear in the force signal. Still, check whether the specimen moved and whether the force-measurement range is appropriate.
If replicate specimens differ more than expected, look beyond the UTM. Compare specimen density, cutting location, loading direction, actual dimensions, surface condition, conditioning, and visible cellular structure.
And if one side collapses well before the other, inspect specimen centering, surface parallelism, and material orientation.
The compressed specimen is often as useful as the graph.
A curve tells you when something happened.
The specimen can help tell you why.
Crosshead Movement Is Not Always Exact Specimen Deformation
A universal testing machine knows how far its moving crosshead traveled.
That does not automatically mean the foam shortened by exactly the same amount.
Crosshead movement can include small contributions from machine compliance, fixture deformation, platen seating, and other parts of the load train.
For routine testing, the displacement method specified by the applicable procedure may be entirely adequate.
Where deformation or modulus accuracy is particularly important, however, confirm what the displacement channel actually measures before treating it as exact specimen strain.
This distinction is also reflected in current international rigid-foam testing. ISO 844:2026 differentiates procedures according to the method used to determine deformation.
For ASTM D1621 work, the practical lesson is straightforward:
Know what your displacement measurement represents.
Running an ASTM D1621 Compression Test
Start with the material or customer specification rather than assuming the ASTM designation answers every setup question.
Requirements for specimen preparation, dimensions, conditioning, orientation, or reporting may be defined by the applicable product specification.
Prepare the specimen and record the dimensions needed for stress and deformation calculations. If the foam has a known manufacturing or rise direction, identify it before testing.
Inspect the loaded surfaces and place the specimen centrally between suitable compression platens.
Establish the required initial contact condition, then run the compression test while recording the complete force-displacement response.
When the test finishes, do not immediately discard the specimen.
Look at it.
Did it compress reasonably uniformly?
Did one side collapse first?
Did it shift between the platens?
Does the physical specimen agree with what the curve appears to show?
Then evaluate the required compression properties according to ASTM D1621 and the applicable material specification.
This is more reliable than treating the UTM as a black box that automatically produces a "compressive strength" value.
ASTM D1621 vs ASTM D695
Both standards involve compression, but they are aimed at different material structures.
| Test Consideration | ASTM D1621 | ASTM D695 |
|---|---|---|
| Material focus | Rigid cellular plastics | Rigid plastics |
| Structure | Cellular / foam | Solid polymer |
| Typical behavior | Cell deformation and collapse | Bulk material compression |
| Typical specimen | Foam block | Solid plastic specimen |
| Main concern | Cellular compression response | Solid-plastic compressive properties |
A rigid PU foam and a solid engineering plastic may both feel rigid in your hand.
That does not make them mechanically equivalent.
If you are testing a solid rigid plastic, ASTM D695 may be the more relevant method.
For a rigid cellular plastic, ASTM D1621 should be evaluated.
This distinction also creates a useful internal-link path between an ASTM D1621 article and an ASTM D695 Compression Testing Guide.
ASTM D1621 vs ISO 844
ISO 844 also covers compression properties of rigid cellular plastics.
The methods address closely related applications, but laboratories should still follow the standard and edition specified by the customer rather than assuming results are automatically interchangeable.
The current ISO edition is ISO 844:2026.
If the requirement states ASTM D1621, run and report ASTM D1621. If it states ISO 844, configure the test around the specified ISO procedure.
The same universal testing machine may support both when correctly configured.
How Much Machine Capacity Do You Need?
Machine selection starts with the expected material response and specimen area.
Suppose:
Expected Maximum Stress = 0.8 MPa
and the specimen face is:
100 × 100 mm
The loaded area is:
10,000 mm²
Since:
1 MPa = 1 N/mm²
the estimated maximum force is:
0.8 × 10,000 = 8,000 N
or:
8 kN
Now the machine-selection discussion has a useful starting point.
But capacity alone is not enough.
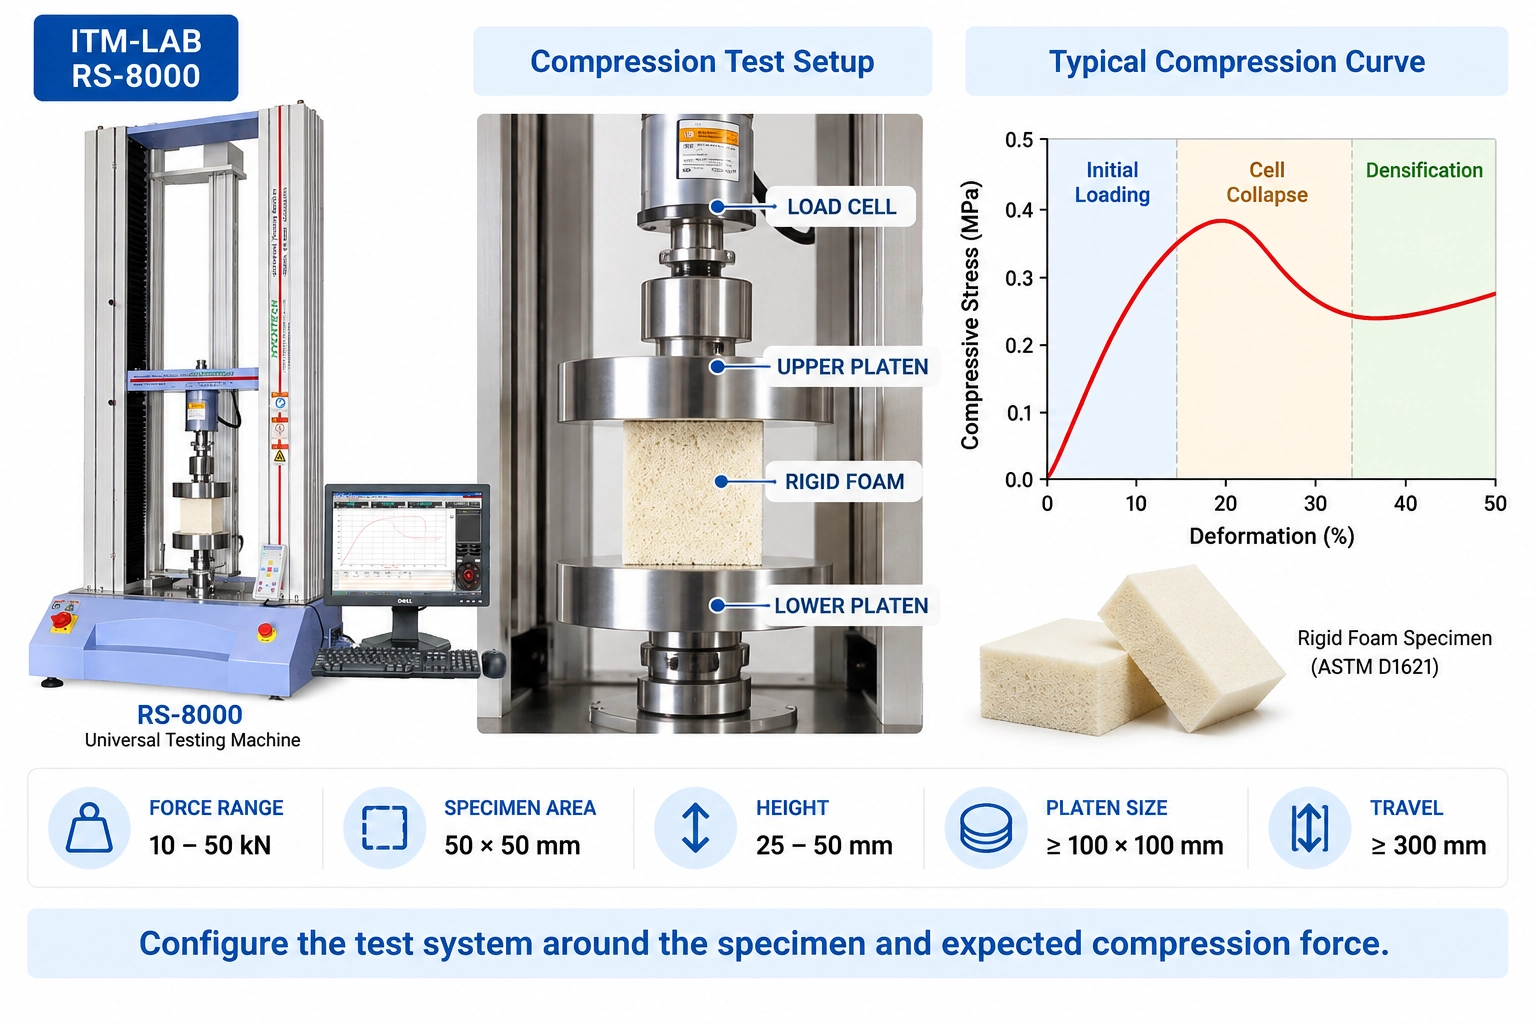
The test system also needs an appropriate force-measurement range, compression platens large enough for the specimen, sufficient vertical test space, enough travel for the required deformation, and the correct displacement and software configuration.
A machine can have enough force capacity and still be poorly matched to the test.
Worked Example: 100 × 100 × 50 mm Rigid PU Foam
Consider a QC laboratory with the following requirement:
Material: Rigid polyurethane foam
Standard: ASTM D1621
Specimen: 100 × 100 × 50 mm
Expected Stress: 0.2–0.8 MPa
Loading Direction: Parallel to rise
Test Volume: 50 specimens/day
Required Output: Compression properties + complete curve
The loaded area is:
100 × 100 = 10,000 mm²
At 0.2 MPa:
F = 0.2 × 10,000 = 2,000 N
At 0.8 MPa:
F = 0.8 × 10,000 = 8,000 N
So the expected working region is approximately:
2–8 kN
Now change only the specimen size.
If the loaded face becomes:
200 × 200 mm
the area becomes:
40,000 mm²
At the same 0.8 MPa:
F = 0.8 × 40,000 = 32,000 N
or:
32 kN
The material did not become four times stronger.
The loaded area became four times larger.
This is why specimen dimensions should be known before machine capacity is finalized.
Configuring the RS-8000 for Rigid Foam Compression
For applications whose calculated force falls within its useful measurement range, the ITM-LAB RS-8000 Universal Testing Machine provides 10–50 kN configurations for larger specimens and higher-force rigid foam compression testing.
For the example above, the configuration would be reviewed around the actual application:
2–8 kN expected working force, 100 × 100 mm loaded face, 50 mm initial height, required compression travel, platen dimensions, test space, displacement measurement, and test volume.
A much smaller low-density foam specimen producing only a few hundred newtons is a different application. In that case, a lower-force system may provide a more appropriate measurement range.
A larger capacity number is not automatically a better test system.
What Should You Send With an ASTM D1621 RFQ?
You do not need to know the complete machine configuration before contacting us.
The specimen information is more useful.
| Requirement | What to Send |
|---|---|
| Material | PU / PIR / EPS / XPS / PVC foam / other |
| Specimen size | L × W × H |
| Loading direction | Rise / transverse / other |
| Expected stress | kPa or MPa, if known |
| Expected force | N or kN, if known |
| Test volume | Specimens/day |
| Required results | Strength / stress / deformation / modulus / curve |
| Standard | ASTM D1621 / customer method |
| Supporting information | Drawing / photo / previous report |
If the expected force is unknown but you know the compressive stress and specimen dimensions, the approximate working force can be estimated from:
Force ≈ Stress × Loaded Area
If neither value is available, send the material datasheet, specimen drawing, previous test report, or sample information.
FAQ
What does ASTM D1621 measure?
ASTM D1621 covers compressive properties of rigid cellular materials, particularly expanded plastics. Depending on the material response and required evaluation, the test can provide compressive stress, compressive strength, deformation behavior, load-deformation data, and effective modulus.
The current ASTM listing is ASTM D1621-16(2023).
How is rigid foam compressive stress calculated?
At the basic stress level:
Compressive Stress = Force / Original Loaded Area
For example:
3,000 N / 10,000 mm² = 0.30 MPa
The specific point used for the reported property should follow ASTM D1621 and any applicable material specification.
What if the foam does not show a clear maximum load?
Do not create a peak artificially.
Some rigid foams produce a recognizable maximum, while others move through progressive cellular collapse without the same clear peak. Evaluate the curve using the procedure required by ASTM D1621 rather than automatically reporting the highest force recorded during the complete test.
Why does loading direction affect rigid foam compression results?
The cellular structure can become oriented during expansion or manufacturing.
Loading parallel to the rise direction may therefore produce a different response from loading in another direction, even when both specimens come from the same panel.
What is the difference between ASTM D1621 and ASTM D695?
ASTM D1621 is intended for rigid cellular materials such as rigid polymer foams. ASTM D695 addresses compressive properties of rigid plastics.
The cellular structure of foam creates different compression mechanics from those of a solid polymer.
What machine capacity is required for ASTM D1621?
There is no single ASTM D1621 machine capacity.
Start by estimating:
Expected Force ≈ Expected Compressive Stress × Loaded Area
Then verify the force-measurement range, specimen dimensions, platen size, test space, required travel, displacement measurement, and software requirements.
Start With the Foam, Not the Machine
ASTM D1621 looks mechanically simple: place a rigid foam specimen between two platens and compress it.
The measurement is more demanding than that description suggests.
Loaded area converts force into stress. Original height establishes the deformation reference. Cellular orientation can change the response. Platen contact affects how load enters the specimen. And the curve shows whether the foam is reaching a maximum, progressively collapsing, or moving into densification.
For equipment selection, start with:
Material → Specimen L × W × H → Loading Direction → Expected Stress → Expected Force
Then determine the load cell, platens, test space, travel, and displacement measurement.
For larger specimens and higher-force rigid foam applications within its working range, the ITM-LAB RS-8000, 10–50 kN, can be configured around those requirements.
